Quick Start
Adding Summaries
PrettyPandas supports many built in summary functions, as well as providing the ability to create your own summaries. Summary functions can be applied over a DataFrame’s rows or columns, or both.
The builtin summary methods are:
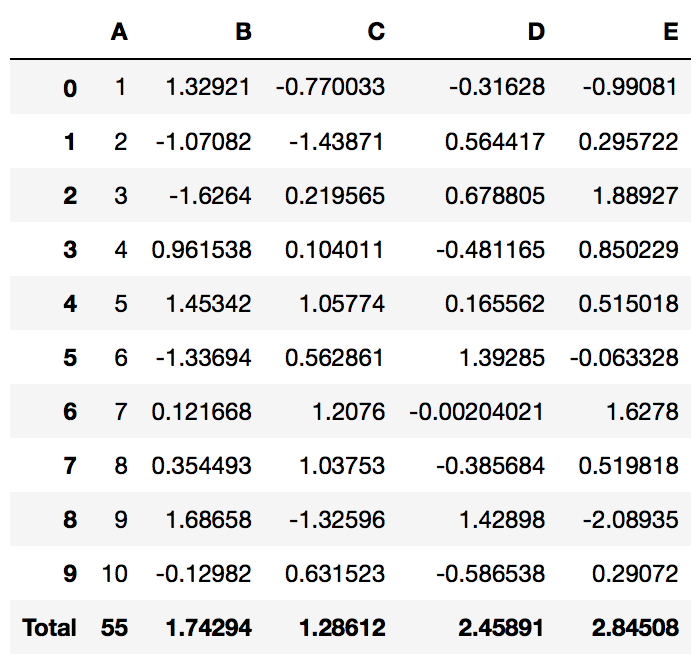
If you wanted to add a grand total to the bottom of your table the code is simple:
PrettyPandas(df).total()
Or additionally if you want to use Pandas fluent API:
df.pipe(PrettyPandas).total()
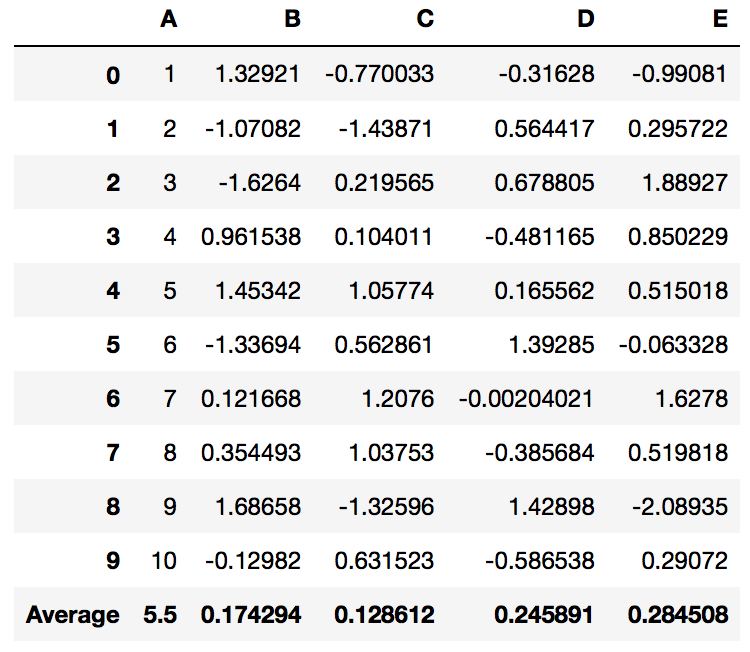
PrettyPandas follows a fluent API so you can chain multiple summaries easily:
df.pipe(PrettyPandas).total().average()
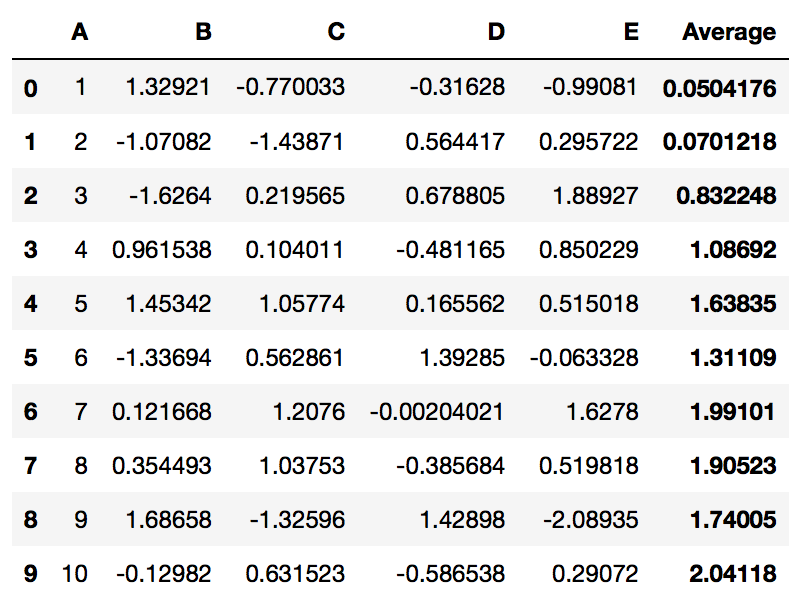
The axis parameter specifies which numpy style axis to apply a summary
on — 0 for columns, 1 for rows, and None for both.
PrettyPandas(df).total(axis=1)
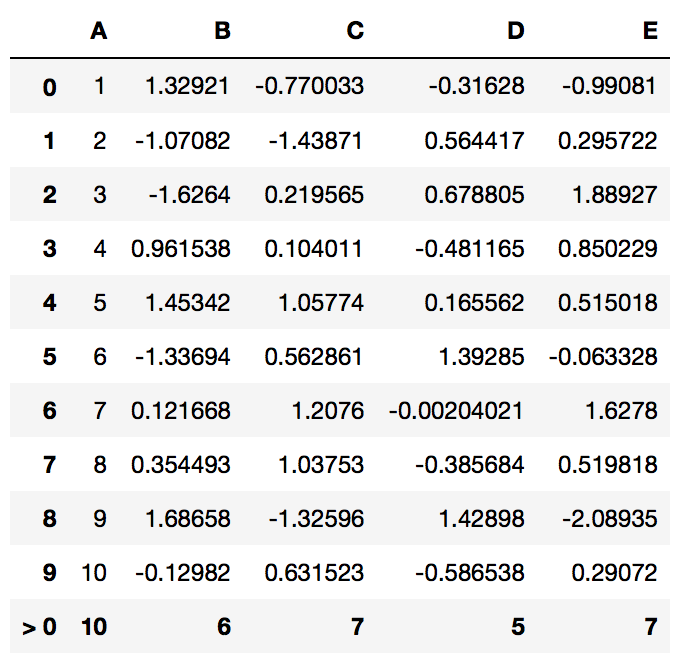
You can even mix and match summaries applied to different axis.
Converting Back to Pandas DataFrame
.to_frame()
After adding summary rows or columns you can get a DataFrame with your changes
applied by calling the ._to_frame.
For example the following code would add a total to your DataFrame and return it back to a Pandas native DataFrame.
(
    df
    .pipe(PrettyPandas)
    .total(axis=1)
    .to_frame()
)
.style
The .style property allows you to drop right into the Pandas Style API.
This code would allow you to compute a summary, format the table using
percentages, and apply a backgrouned gradient to a table:
(
    df.pipe(PrettyPandas)
    .as_percent(precision=0)
    .median()
    .style
    .background_gradient()
)
Formatting Numbers
Most reports use at least some units of measurement. PrettyPandas currently supports percentages, money, and a more general unit method.
The as_unit method takes a positional unit argument which indicates the
string representing the unit to be used and a location argument to specify
whether the unit should be a prefix or suffix to the value.
The as_currency and as_percent methods are localized to use whatever
units your Python distribution thinks are best for you. If you aren’t getting
the correct units use the set_locale method to specify your locale.
If you need to use a different currency, just pass it to currency='...' to
change it.
The as_money method takes optional currency and location arguments
which work just like the as_unit method. By default the currency is in
dollars.
Note
Python 2 doesn’t support unicode literals by default. You can use unicode
literals (e.g. u'€') or import the unicode literal behaviour from
Python 3:
from __future__ import unicode_literals
Formatting Columns
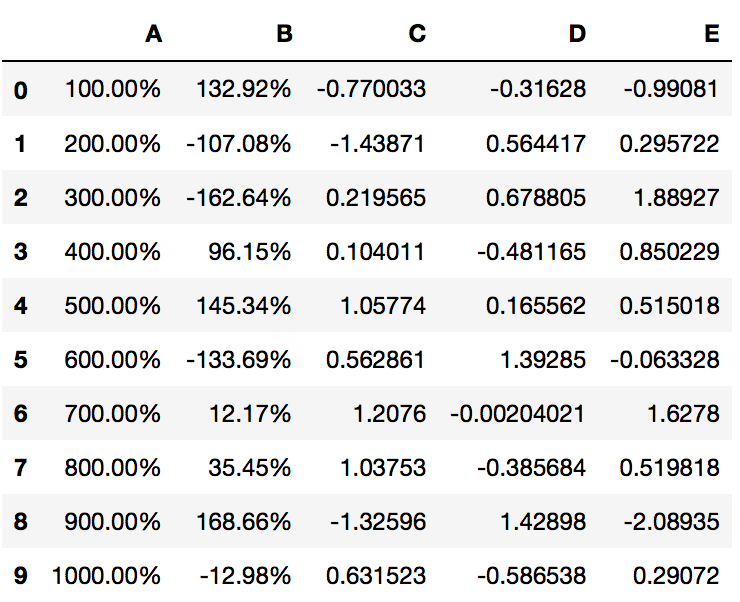
By default the formatting methods apply to the entire dataframe. When you need to format just a few columns you can use the subset argument to specify a single column, or multiple columns.
PrettyPandas(df).as_percent(subset='A') # Format just column A
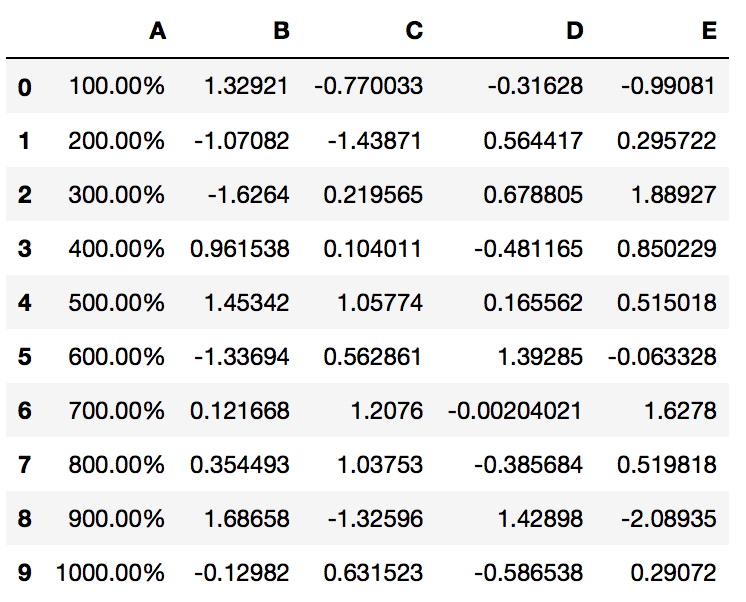
PrettyPandas(df).as_percent(subset=['A', 'B']) # Format columns A and B
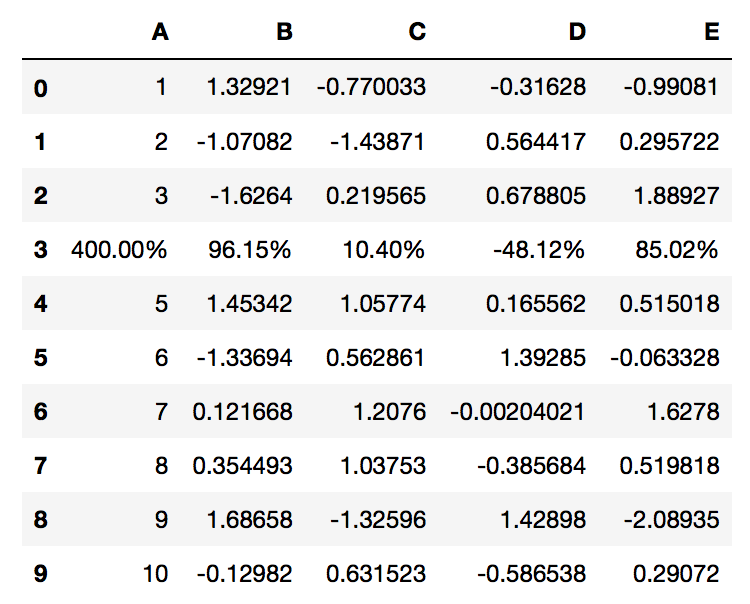
Formatting Rows and Complex Formatting
Formatting rows is more complicated than formatting columns. The subset argument needs to take in a pandas.Index to specify the row.
# Format the row with row-index 3
PrettyPandas(df).as_percent(subset=pd.IndexSlice[3,:], precision=2)
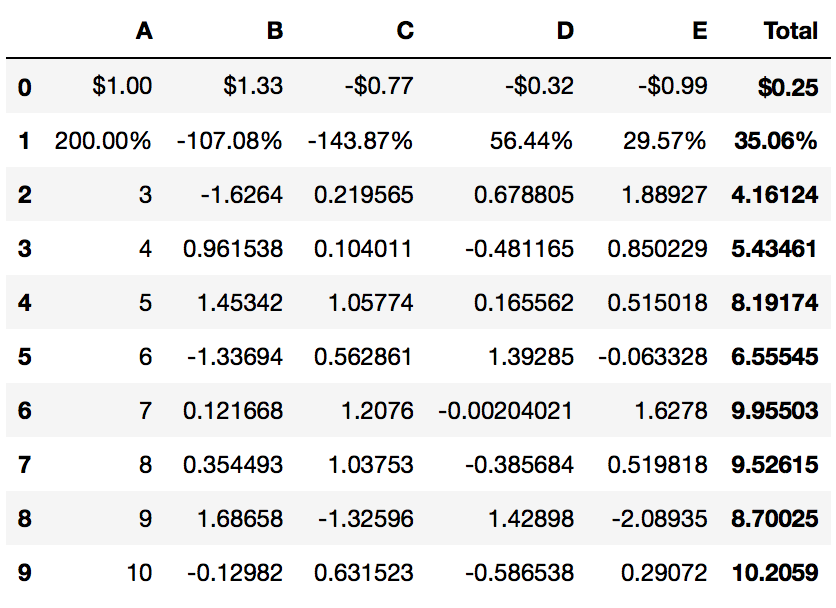
For multi-index dataframes subsetting is more complicated. You will need to use
multiple pandas.IndexSlice objects to get the correct rows.
The following example shows how to select rows in a multi-index:
first_row_idx = pd.IndexSlice[0, :]
second_row_idx = pd.IndexSlice[1, :]

(
    df.pipe(PrettyPandas)
    .as_currency(subset=first_row_idx)
    .as_percent(subset=second_row_idx)
    .total(axis=1)
)
For more info on Pandas indexing, read Pandas Indexing and Pandas Advanced Indexing.